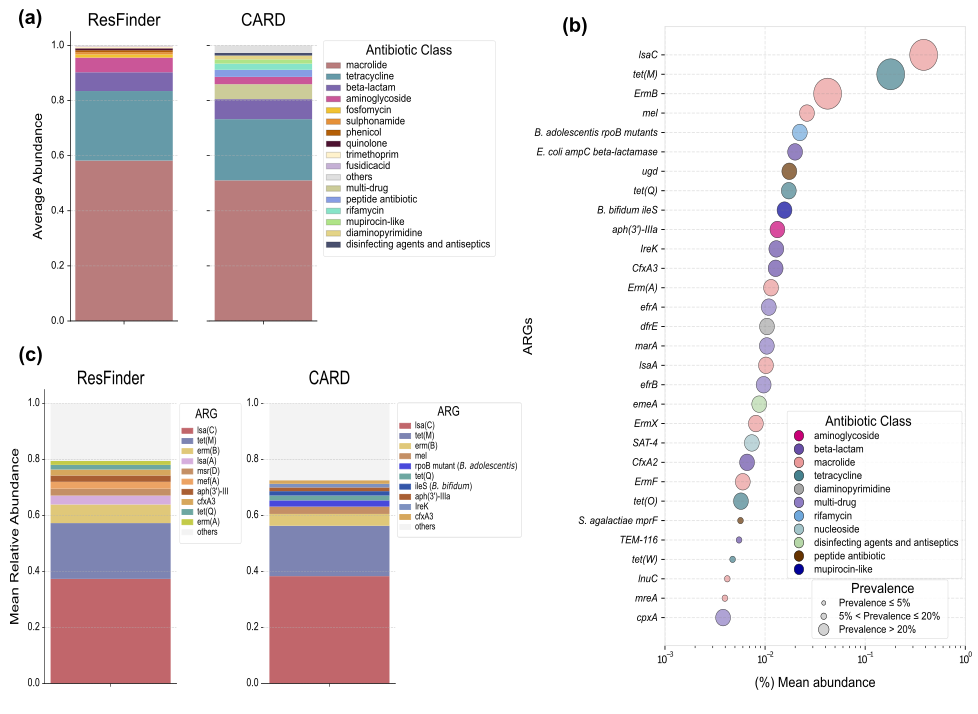
Supplementary Figure 3.
Relative abundance distribution of the top 10 antibiotic resistance genes (ARGs) (a) and corresponding antibiotic resistance classes (b) across all ARG-positive samples. (c) Prevalence and average abundance of the top 20 antibiotic resistance genes detected using the CARD database. Each bubble represents one of the 20 most abundant ARGs: horizontal position shows mean relative abundance (log scale), bubble size reflects gene prevalence, and bubble color corresponds to antibiotic class.
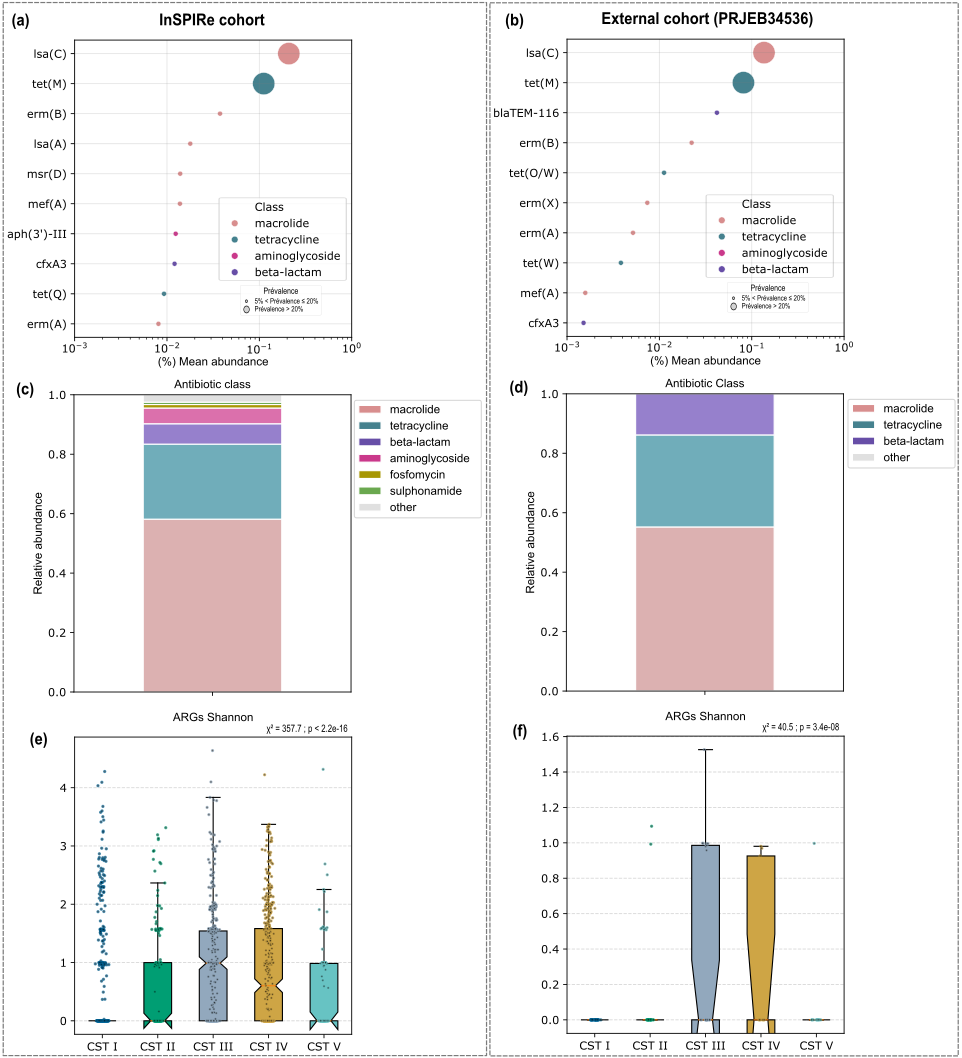
Supplementary Figure 5.
Visual comparison between the InSPIRe cohort and an external dataset (European Nucleotide Archive accession PRJEB34536) (left to right). Bubble plots show the 10 most abundant and prevalent ARGs, where bubble size represents prevalence and colors indicate antibiotic resistance classes (a, b). Panels (c, d) show the relative abundance of detected antibiotic resistance classes. Panels (e, f) show boxplots of the Shannon diversity index for ARGs across CSTs.