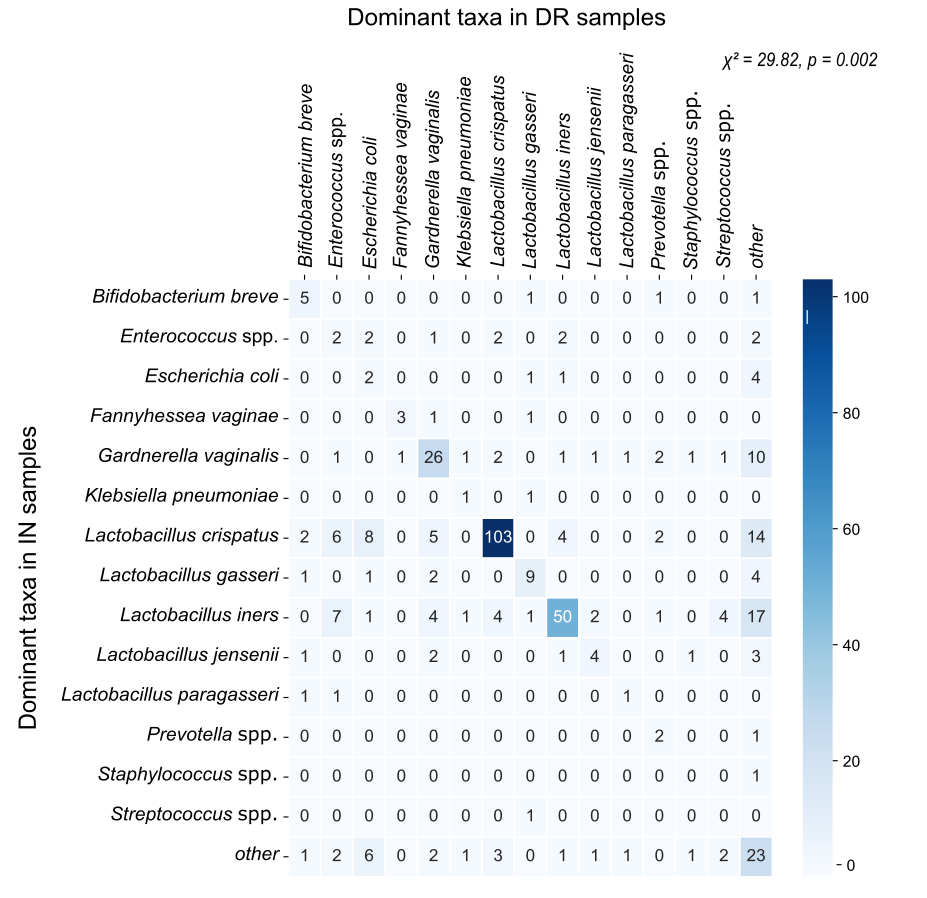
Supplementary Figure 2.
Heatmap showing the frequency transition matrix in dominant species between inclusion (IN) and delivery (DR) samples. Taxa were classified as dominant if they constituted ≥ 30 % of the profile. ‘other’ refers to the number of samples with a different dominant taxon. Rows represent the dominant species at inclusion and columns at delivery. Values correspond to the number of individuals with a given transition. Statistical significance of inter-species differences in stability rate was assessed using a Monte Carlo permutation test on the χ² statistic.
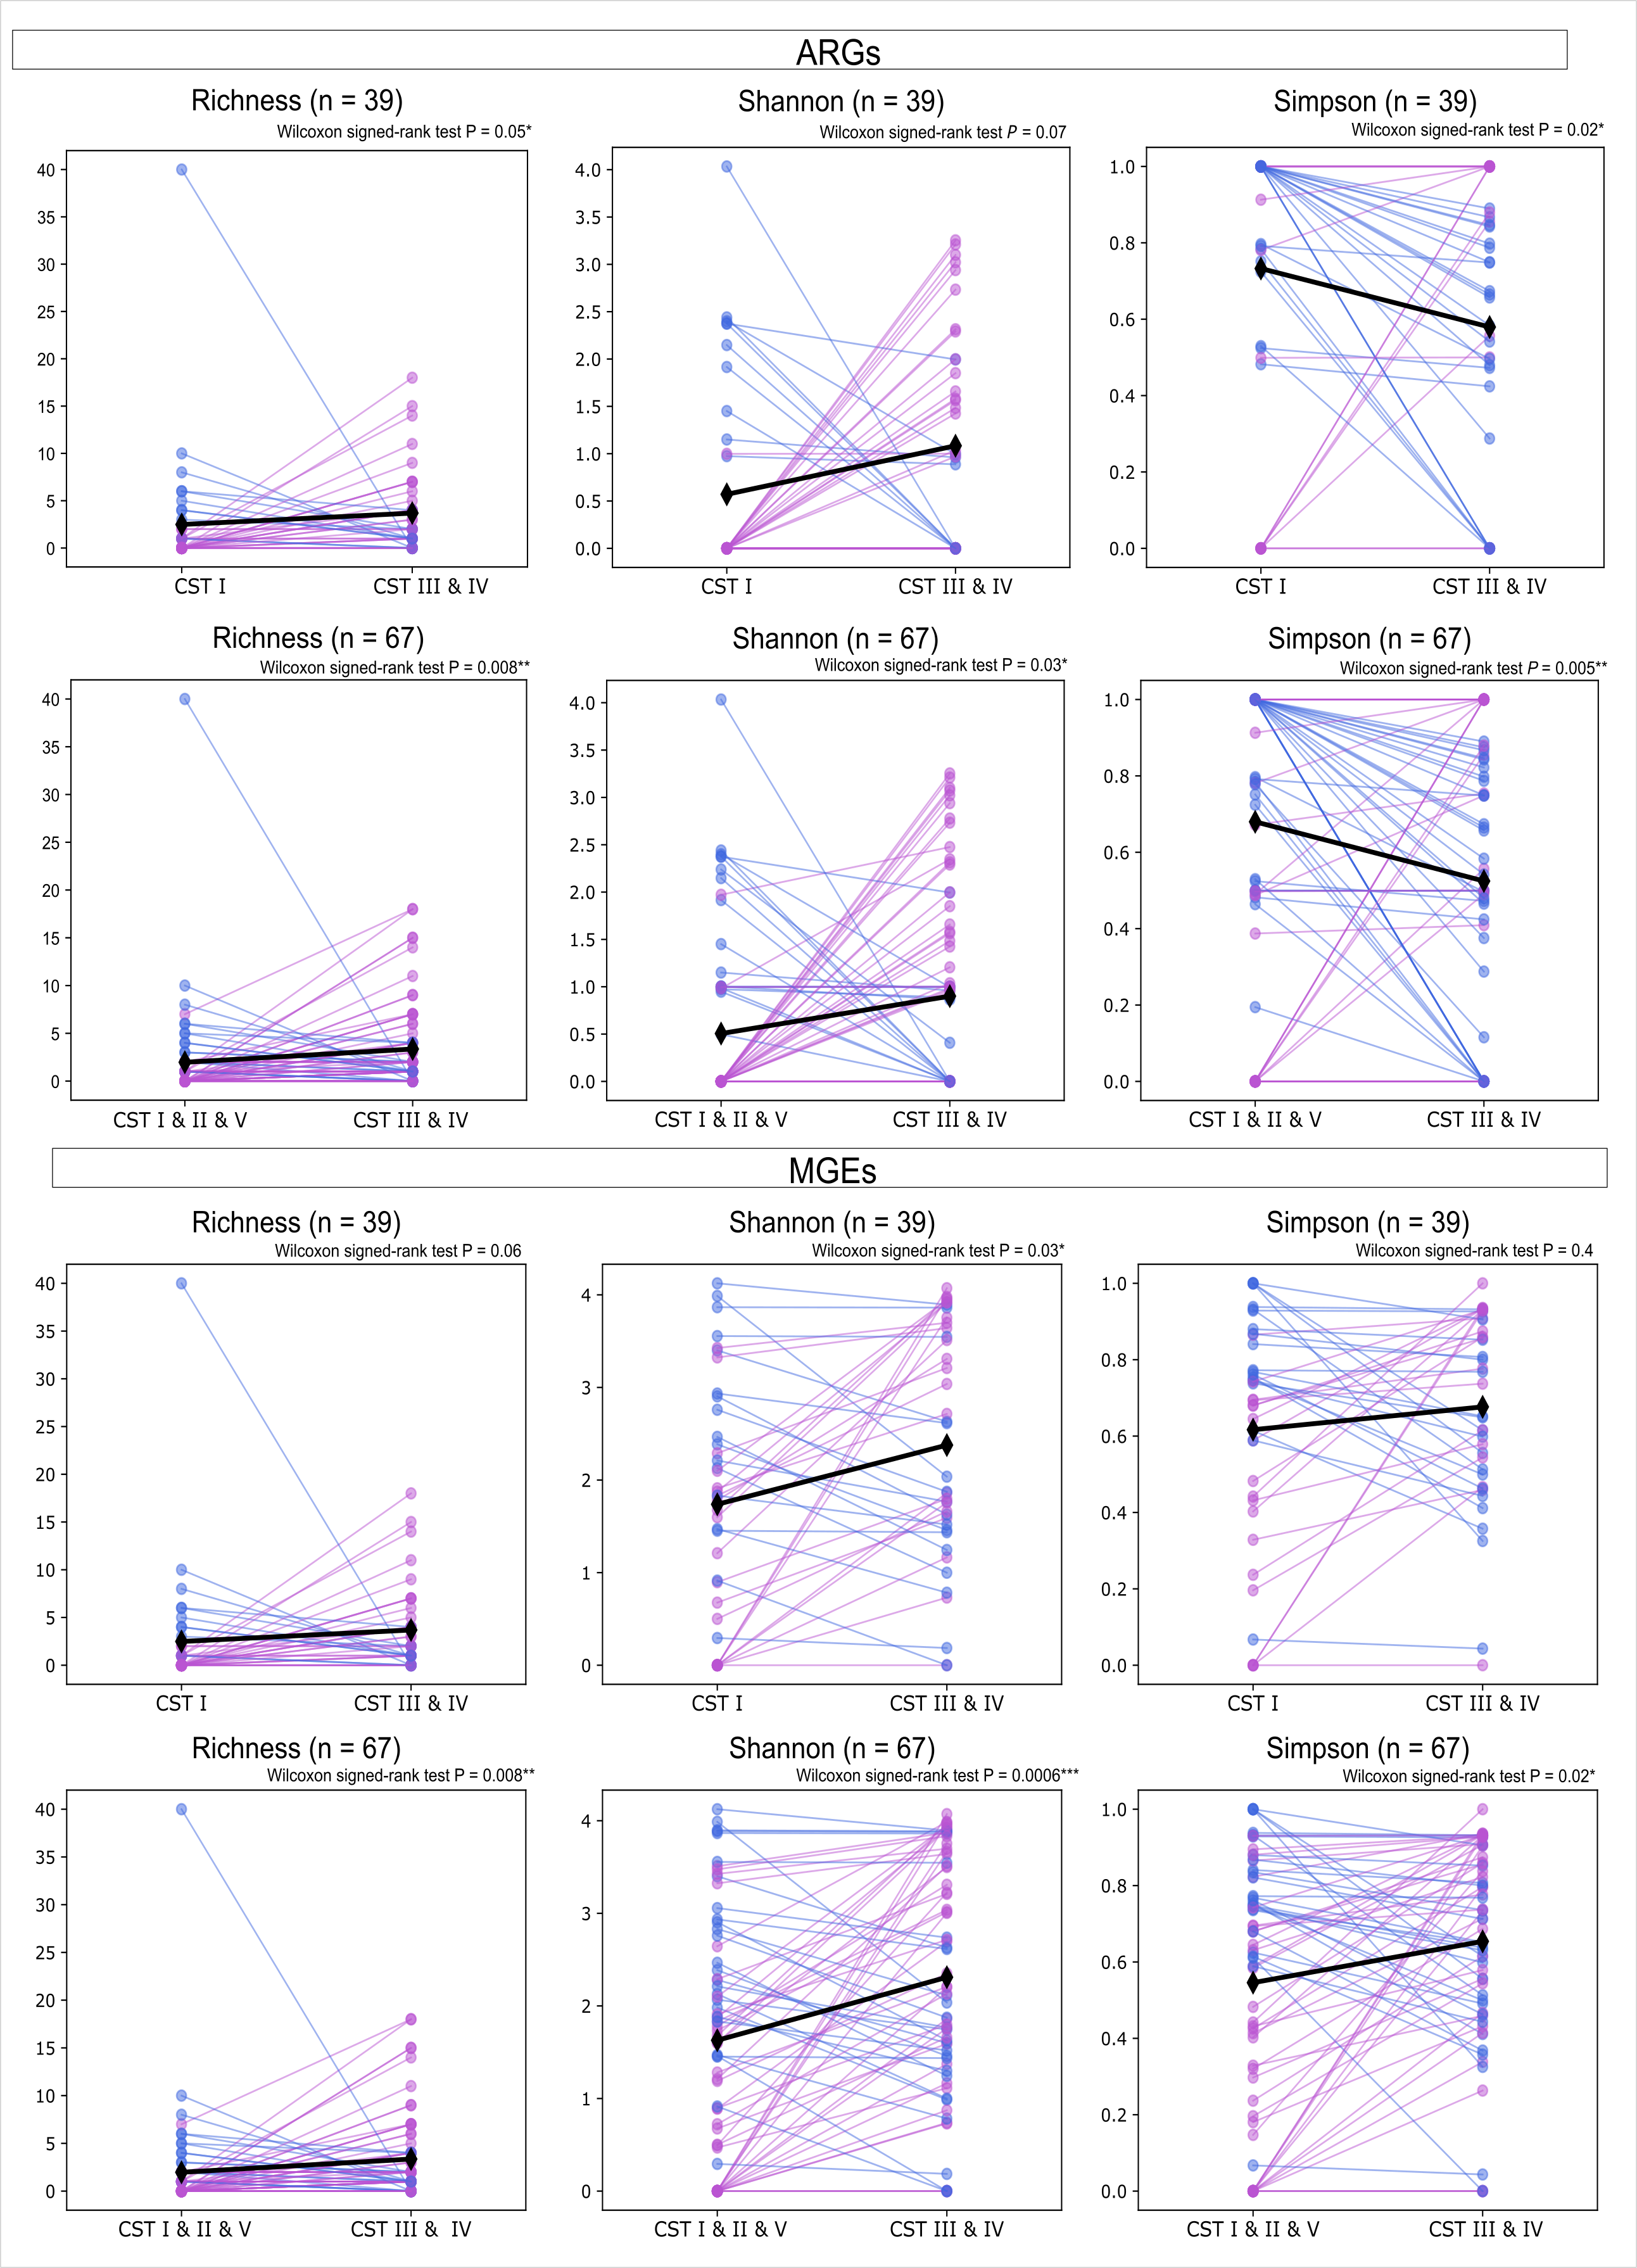
Supplementary Figure 8.
Each panel shows patient-matched diversity metrics comparing samples transitioning between community state types (CSTs): from CST I (a–c) or from CSTs I, II or V to CST III or IV (d–f).Lines connect values from the same individual. α-diversity metrics : observed richness (a, d), Shannon index (b, e), and Simpson index (c, f). Panels g–i and j–l depicts the same comparisons for mobile genetic elements (MGEs).