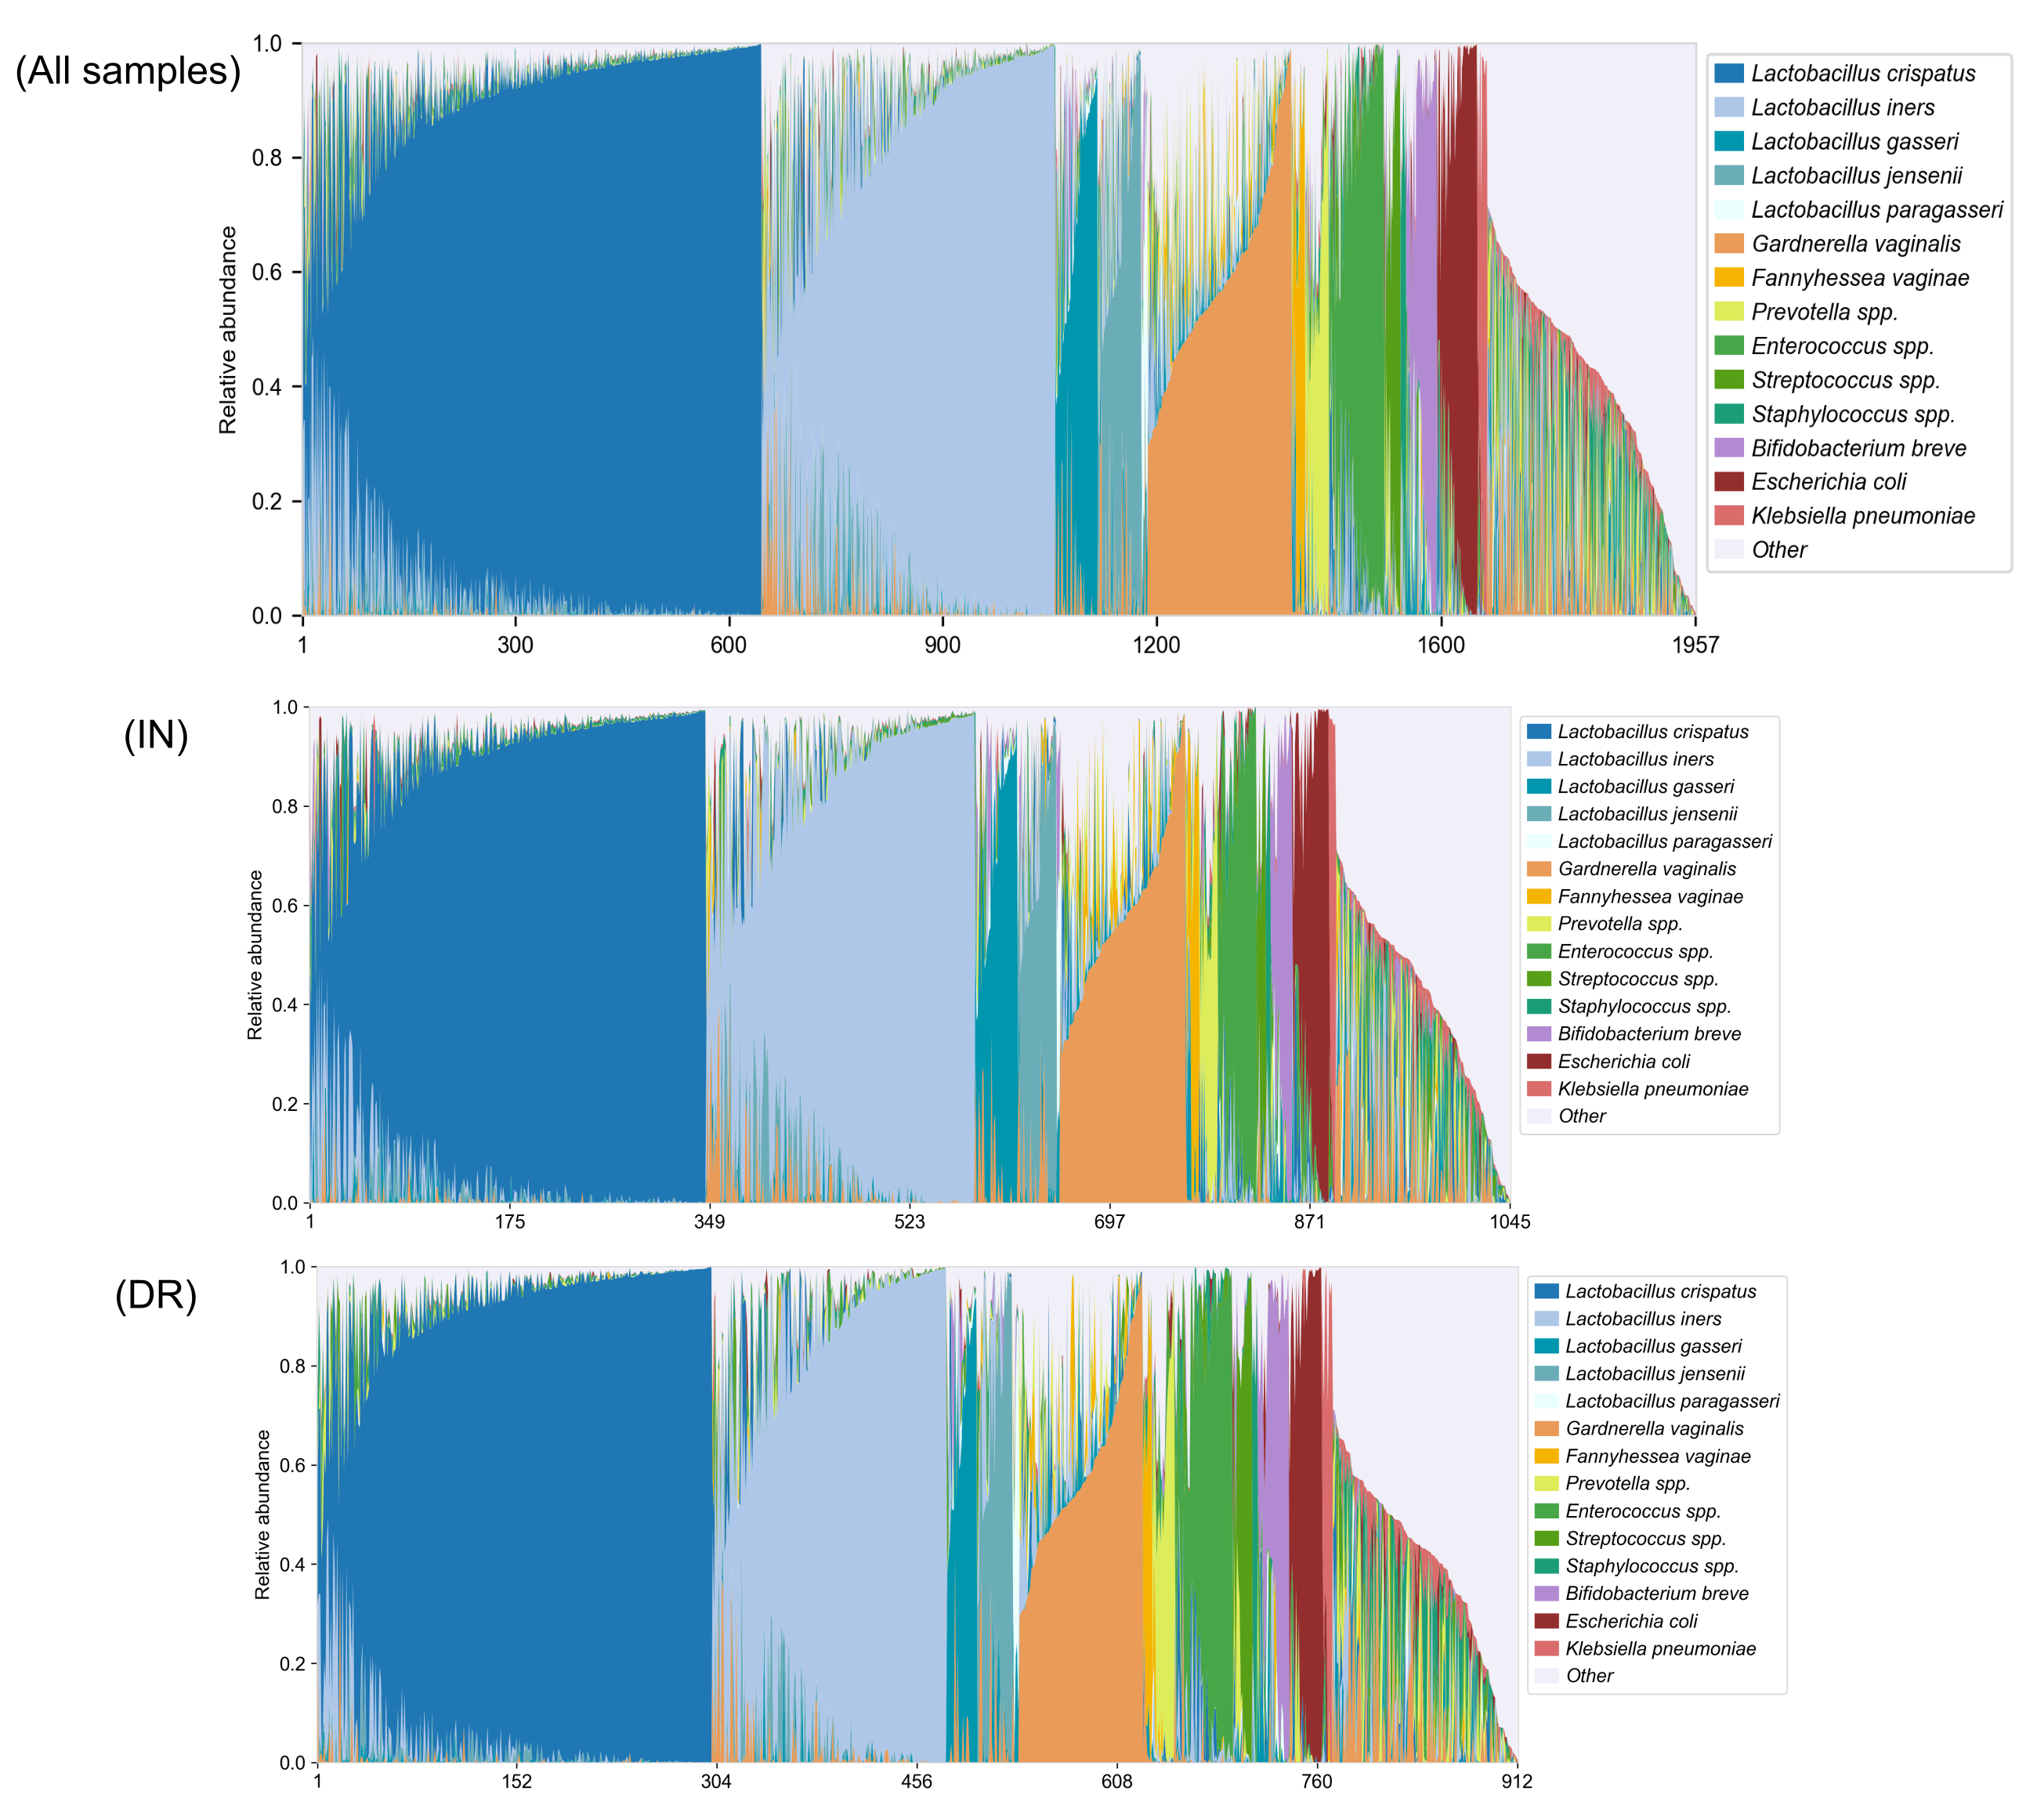
Supplementary Figure 1.
Taxonomic composition of all samples (n = 1,957) and of the subset collected at inclusion (IN; n = 1,045) and at delivery (DR; n = 912). The top 14 most abundant species are shown; all remaining species were grouped under “Other”.
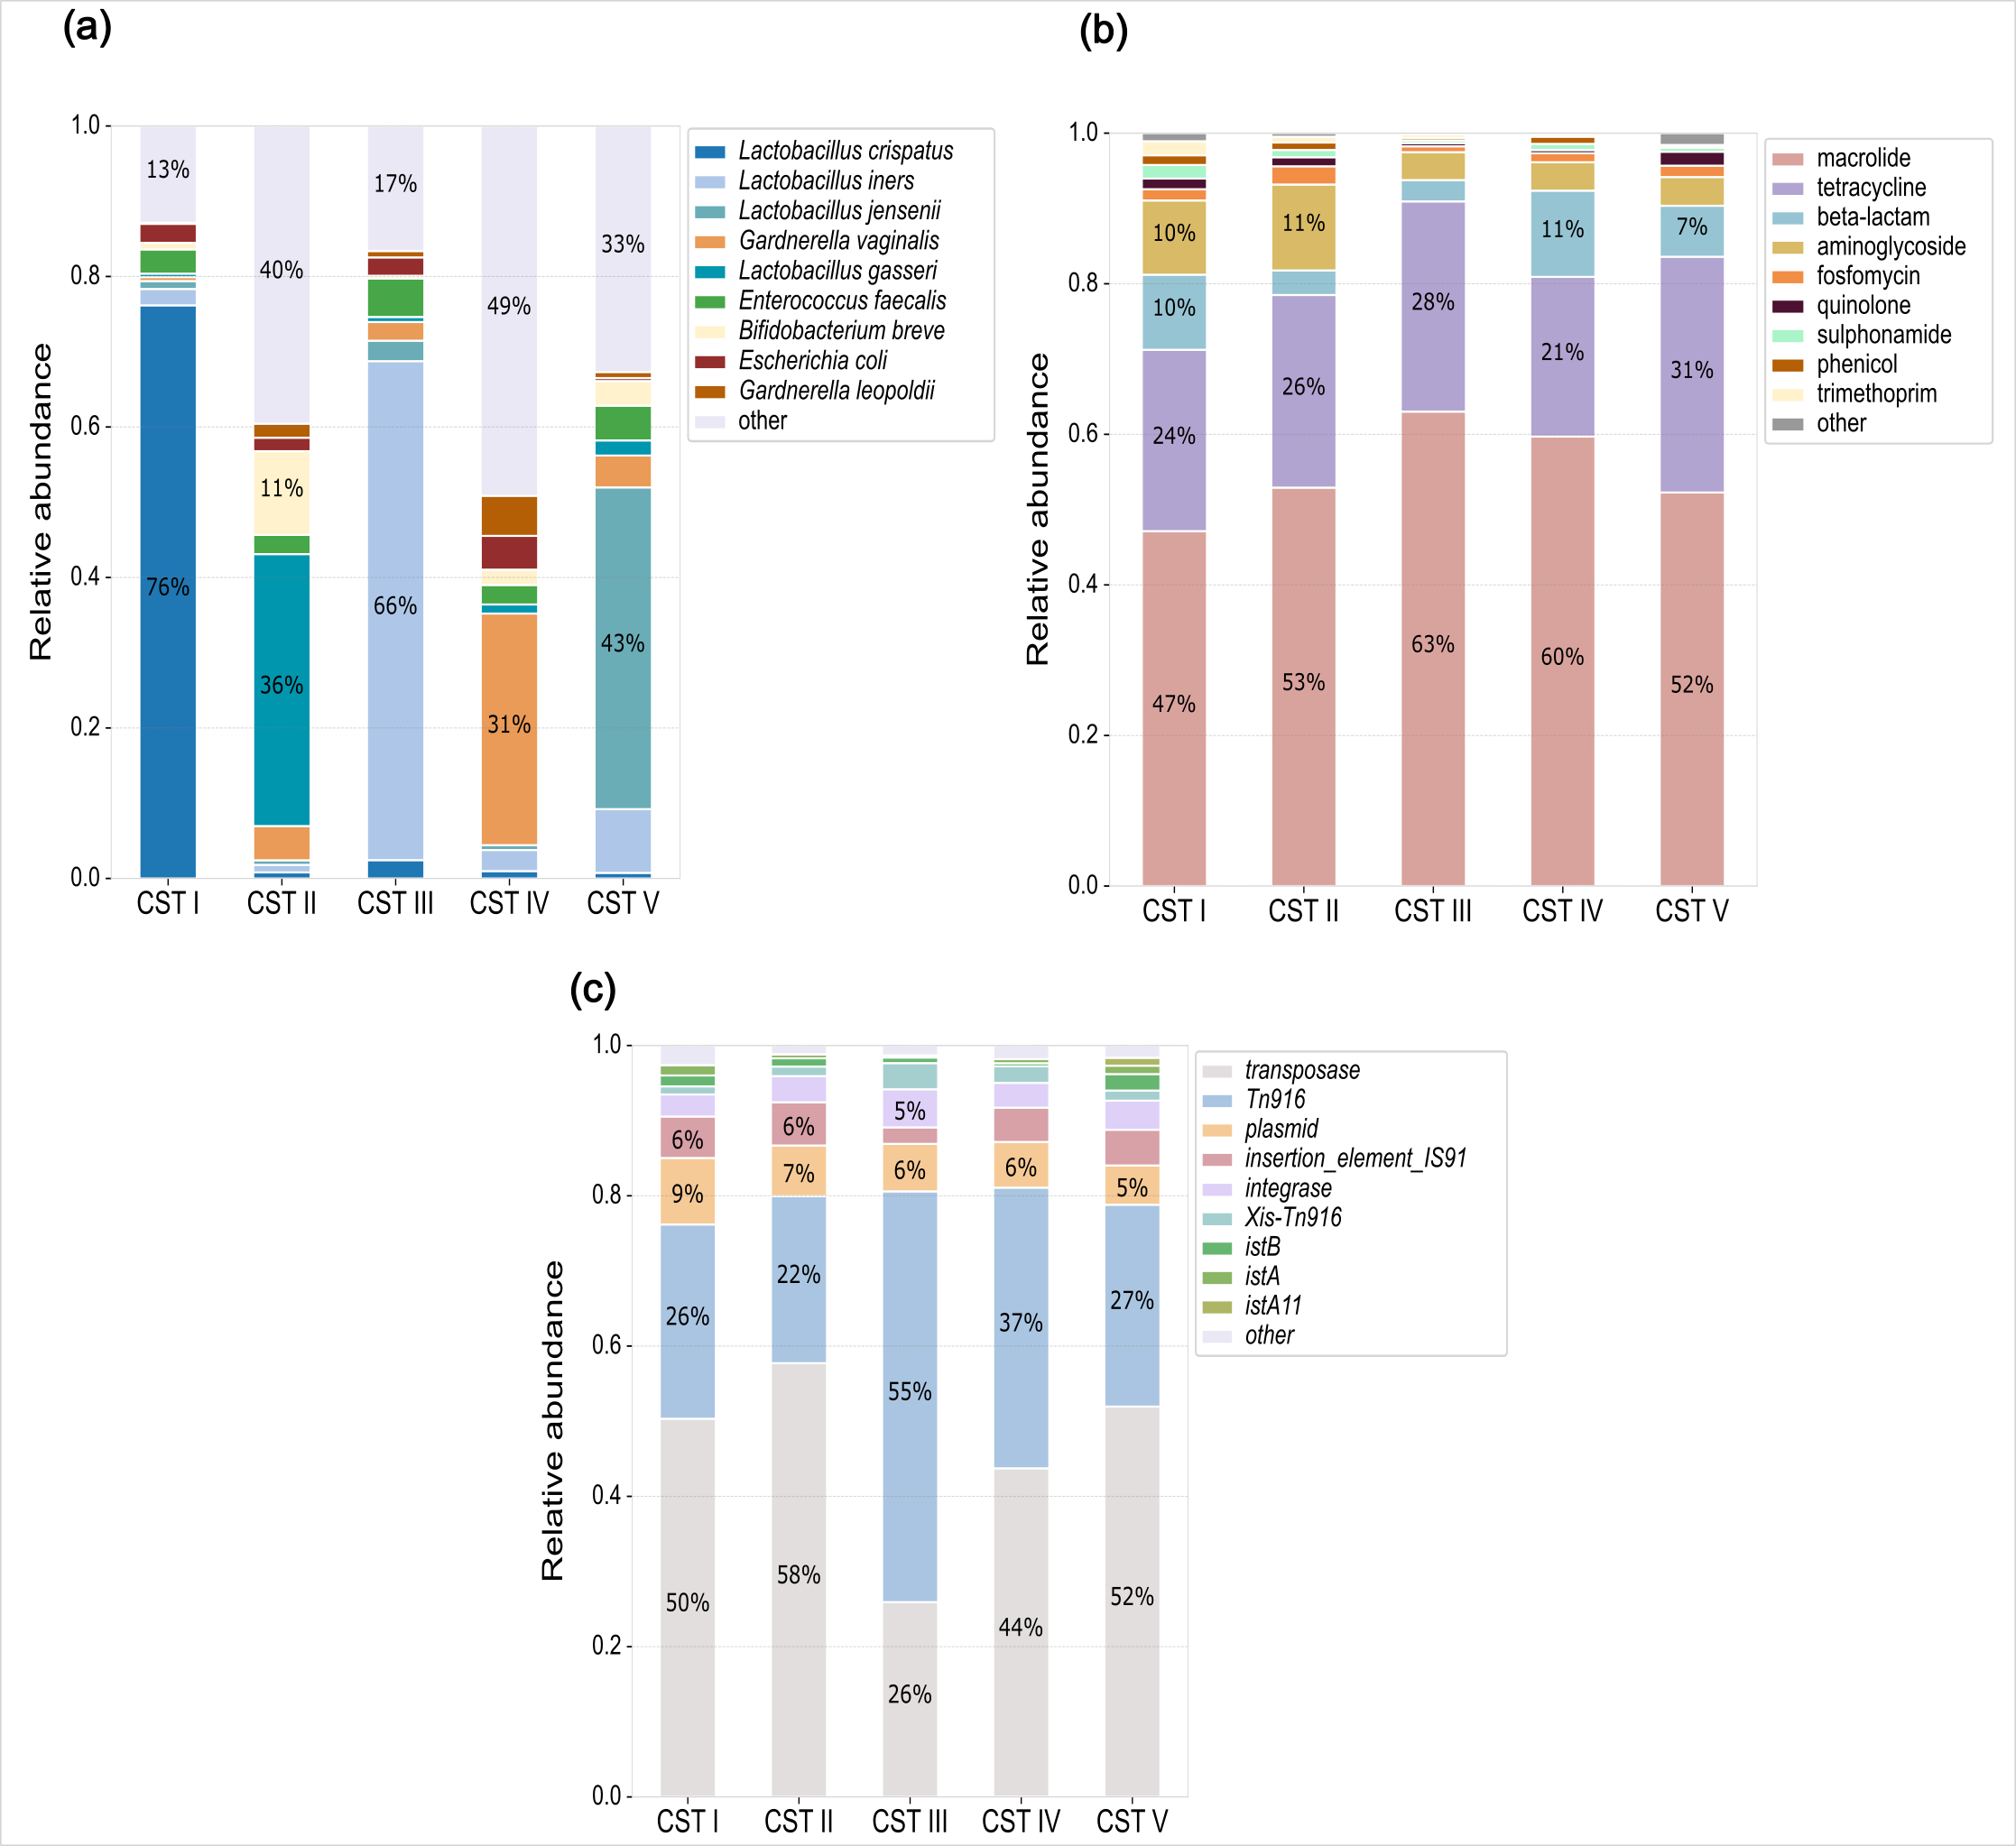
Supplementary Figure 6.
Relative abundance of microbial taxa (a), antibiotic resistance genes (ARGs) (b), and mobile genetic element (MGE) families (c) across community state types (CSTs).
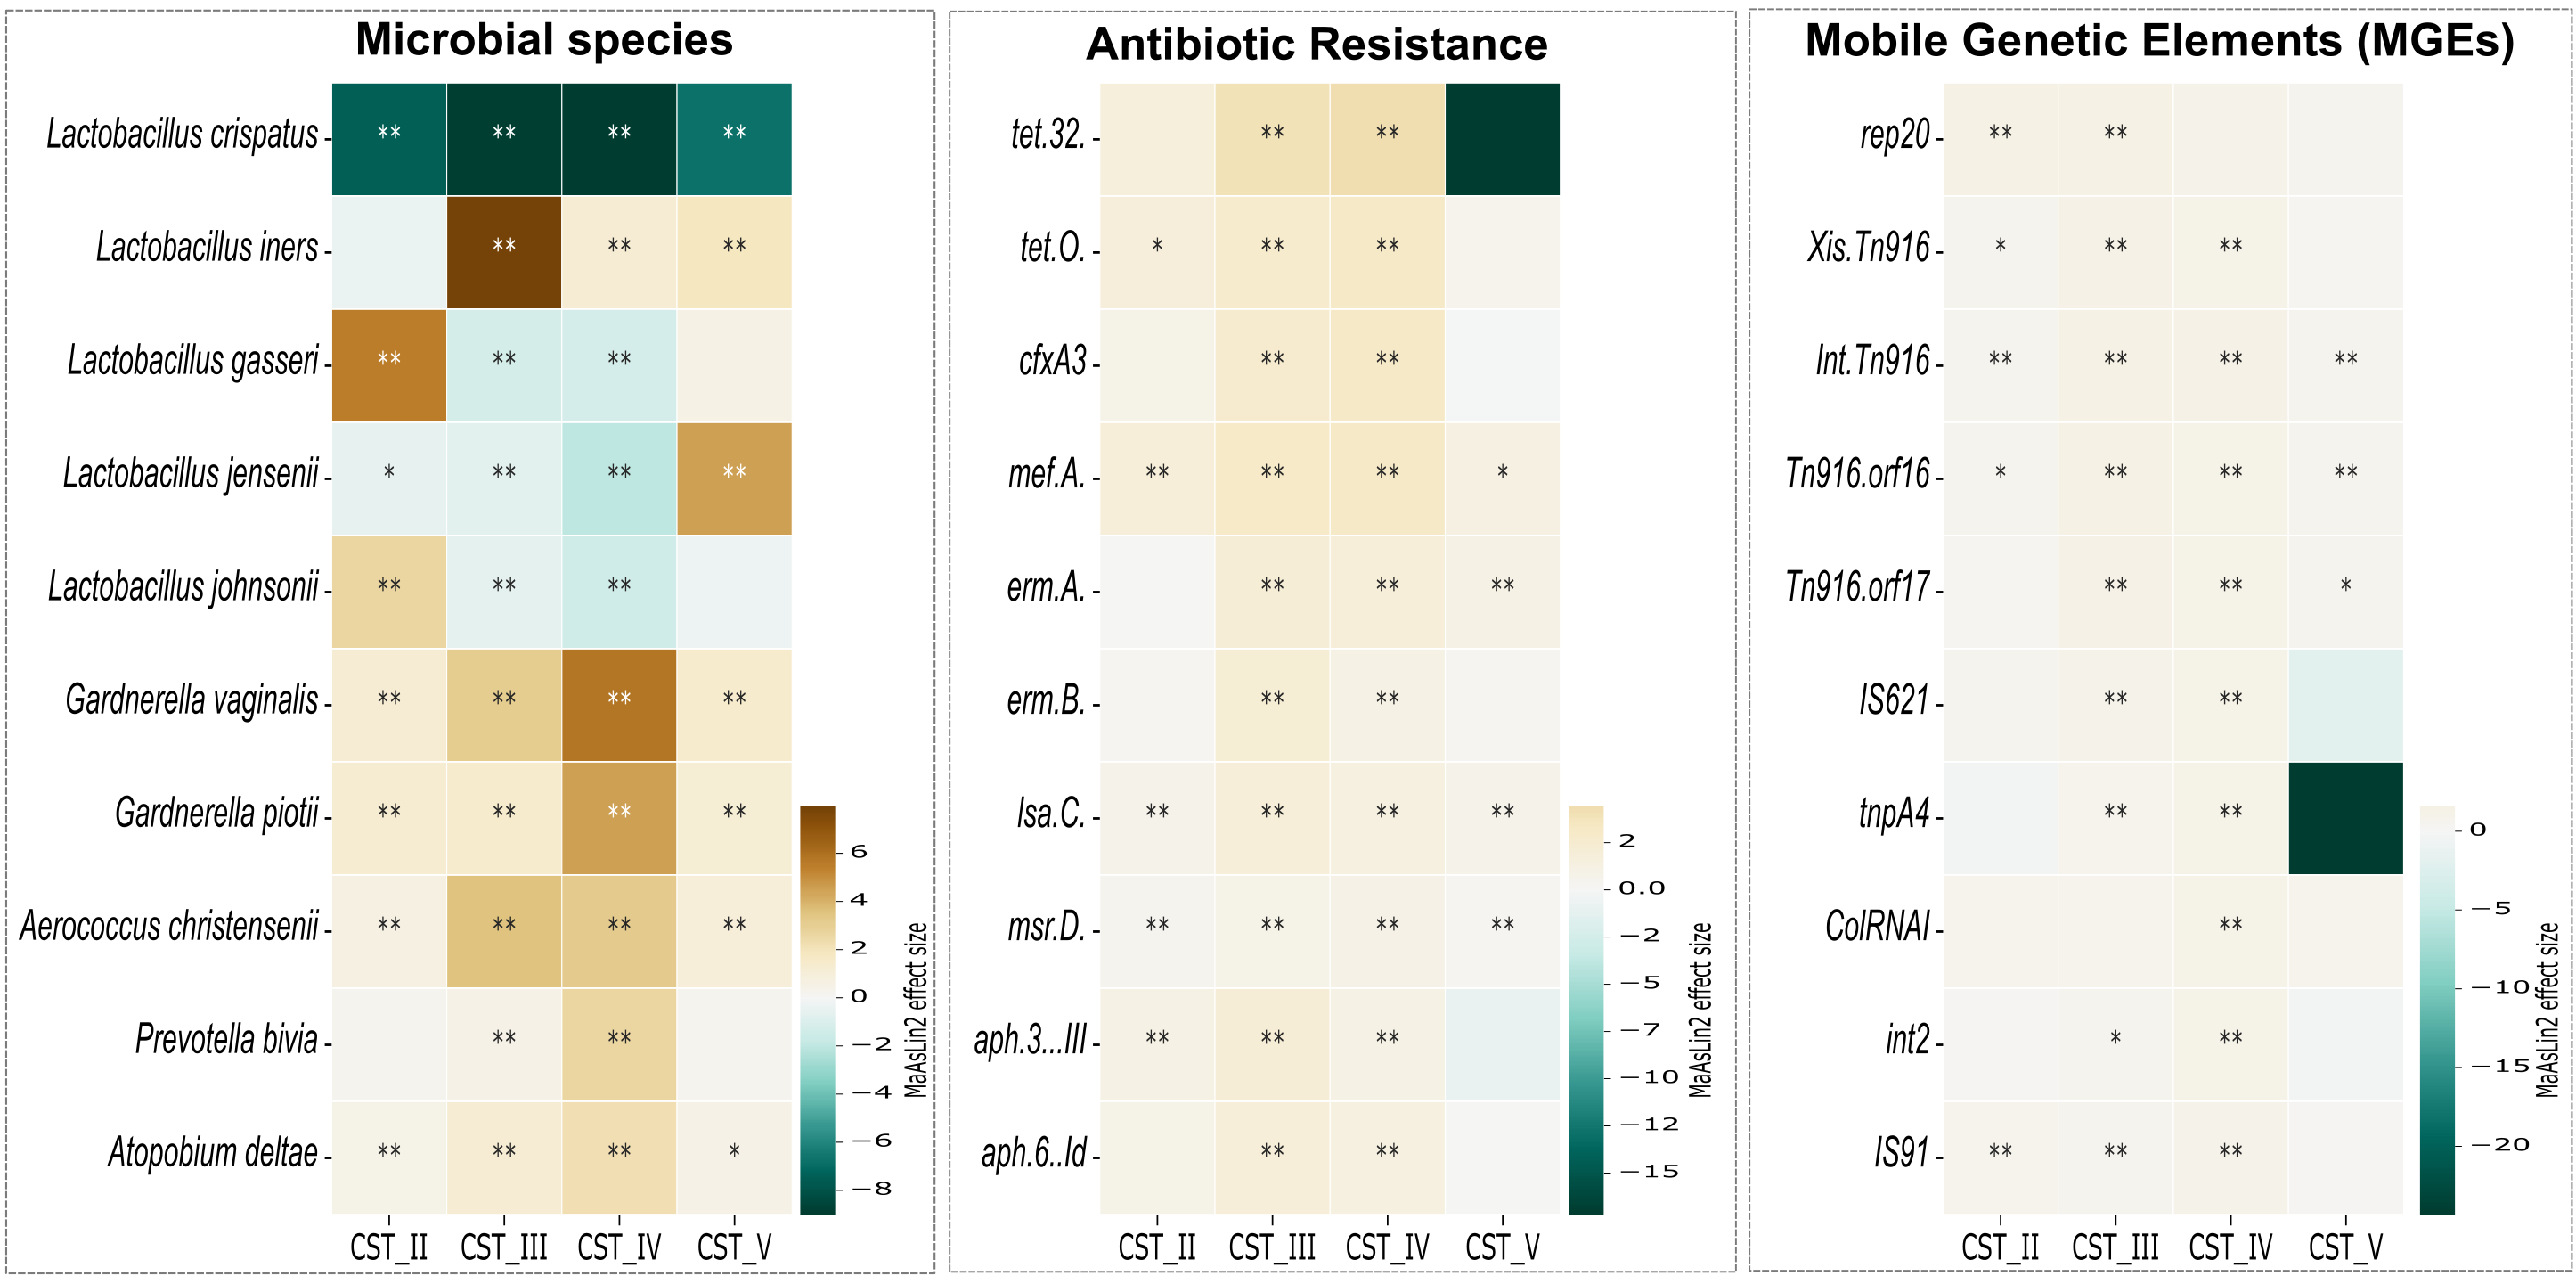
Supplementary Figure 7.
Heatmaps of MaAsLin2 effect sizes for (a) microbial species, (b) antibiotic resistance genes (ARGs), (c) mobile genetic elements (MGEs) across CSTs, with CST I set as reference. All models included patient ID as a random effect to account for repeated sampling. The color scale indicates the magnitude and direction of the effect size (positive values in brown for enrichment, negative values in blue for depletion). Significant results were annotated with an asterisk mark (* for an adjusted p-value < 0.1; and ** for adjusted p-value < 0.05)
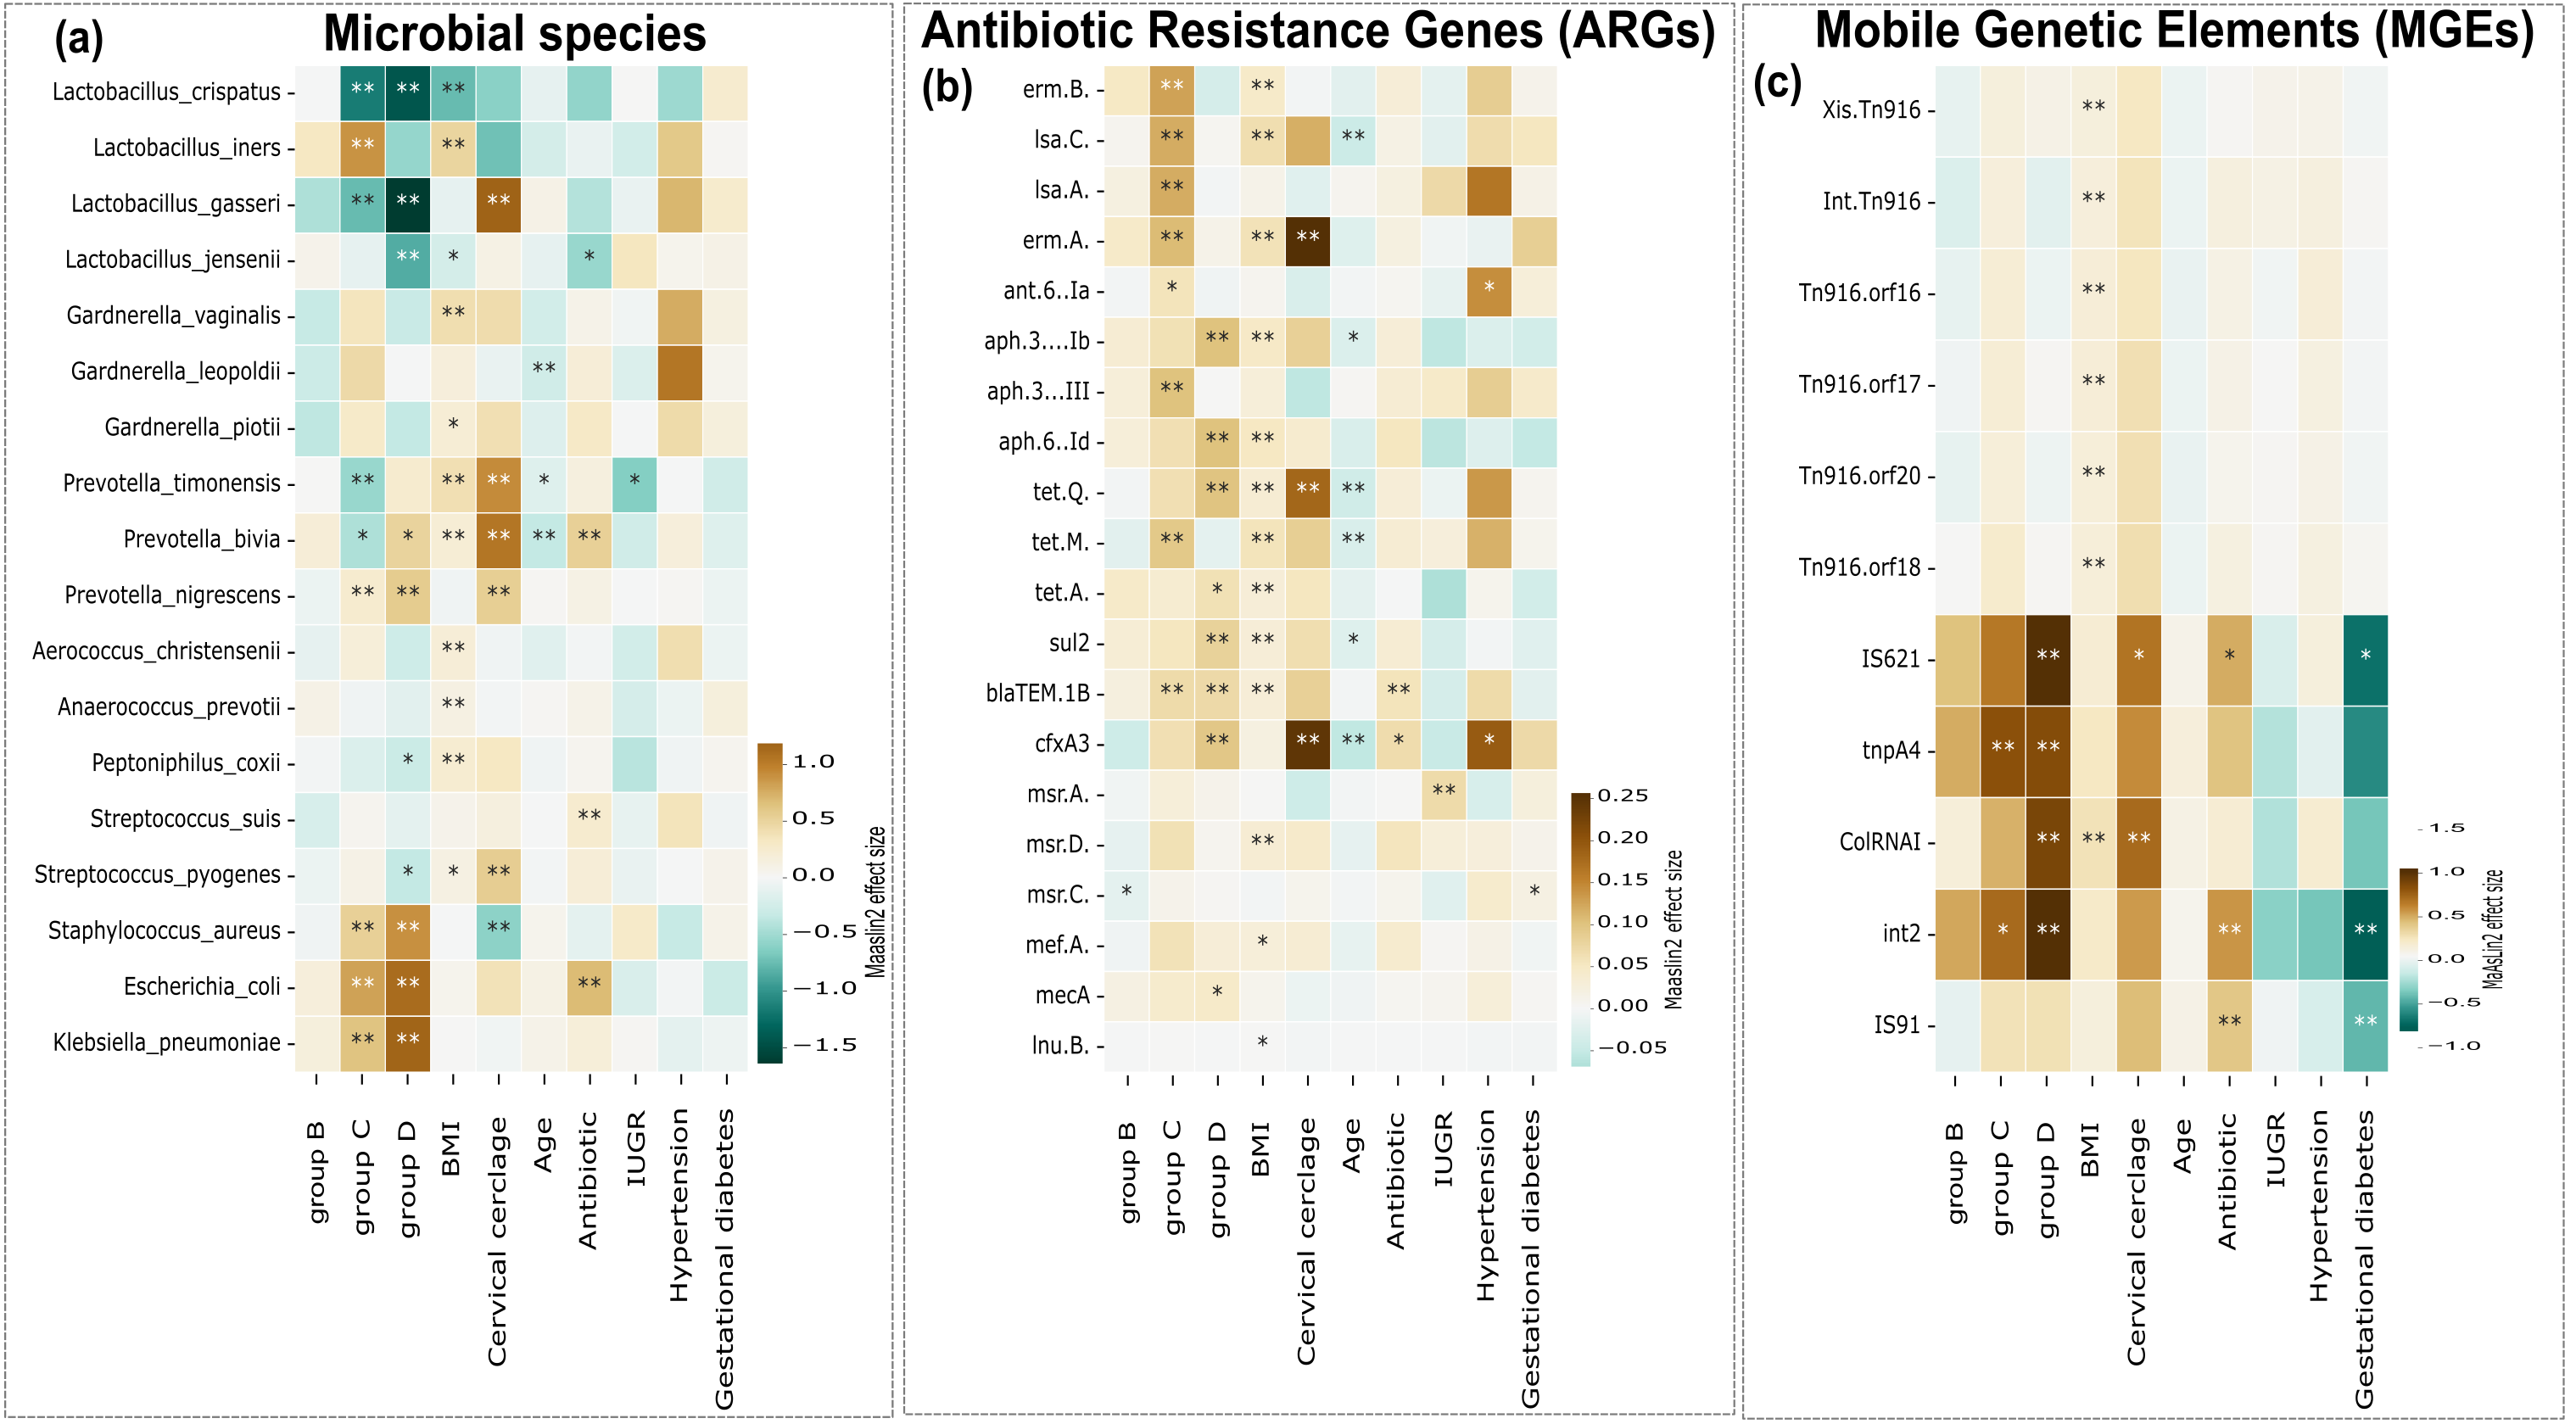
Supplementary Figure 12.
Heatmaps of MaAsLin2 effect sizes for (a) microbial species, (b) antibiotic resistance genes (ARGs), (c) mobile genetic elements (MGEs) across clinical groups (A-C), with group set as reference. A: Full Term (Control); B: Full Term Early Membrane Rupture (PROM); (C) Preterm Labor (PTL); (D) Premature Early Membrane Rupture (PPROM). This figure extends the visualization to all covariates included in the models. The color scale indicates the magnitude and direction of the effect size (positive values in brown for enrichment, negative values in blue for depletion). Significant results were annotated with an asterisk mark (* for an adjusted p-value < 0.1; and ** for adjusted p-value < 0.05)